QR Code Campaign Analytics: The Metrics That Matter (2026)
Scan counts alone do not tell you if a QR campaign worked. Here are the QR code campaign metrics that actually matter in 2026, how to read them, and how to turn scan data into decisions that improve results.

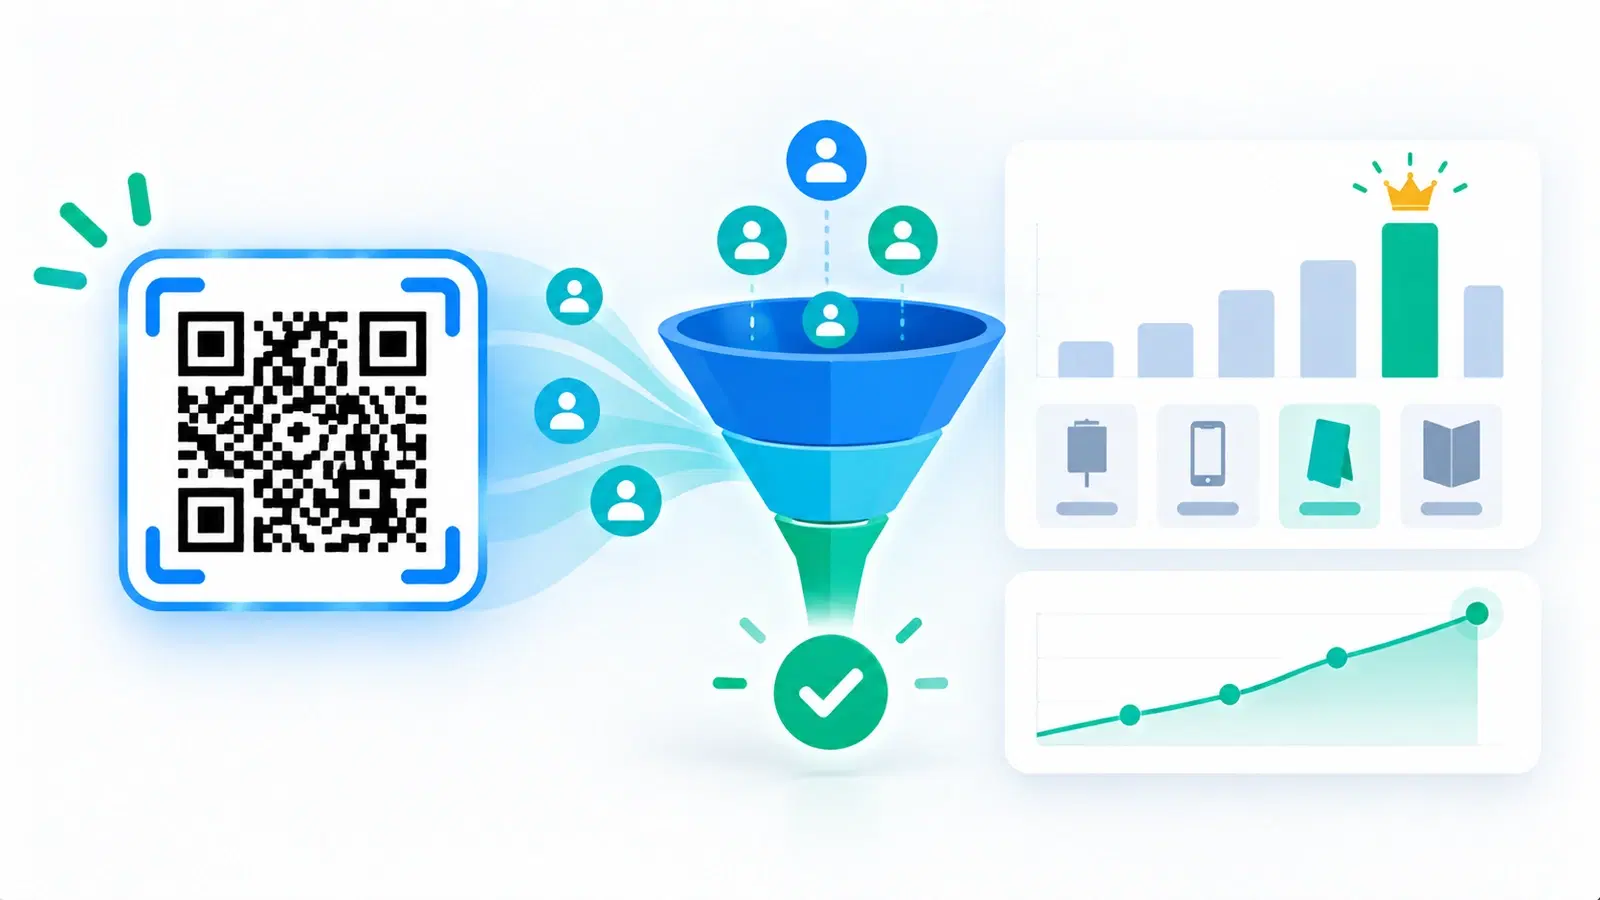
Most people measuring a QR campaign look at one number: total scans. It feels like the obvious metric, but on its own it tells you almost nothing about whether the campaign actually worked. A code with thousands of scans that led to zero sales failed; a code with modest scans that drove real conversions succeeded. Scan count is a starting point, not an answer.
This guide is about QR code campaign analytics specifically: the metrics that actually matter for judging and improving a campaign, how to read them, and how to turn scan data into decisions. It goes beyond "how many scans" to the numbers that tell you whether the campaign moved the needle and how to make the next one better.
This is a marketing-measurement view, focused on campaign KPIs and reporting. For the underlying question of what a QR platform can technically capture per scan, see what QR analytics can track; for cost/ROI budgeting, see QR code cost per scan. Here we focus on the metrics that matter and how to act on them.
Beyond Scan Count: The Metrics That Matter
Total scans is where most people stop, but the metrics that reveal whether a campaign worked go further. Here are the ones that matter, roughly from top-of-funnel to bottom.
1. Total scans (the starting point). Useful as a baseline of reach and awareness, but only that. It tells you how many people took the first step, not whether anything came of it. Never judge a campaign on scans alone.
2. Unique vs repeat scans. Many platforms distinguish unique scanners from repeat scans. Unique scans approximate how many distinct people engaged; repeat scans can indicate strong interest (people coming back) or, in some cases, one person testing. Knowing the split gives a truer picture of reach than raw totals.
3. Conversions (the metric that actually matters). The single most important number: how many scans led to the outcome you wanted, a sign-up, a purchase, a booking, a form submission, a review. A scan is a means; the conversion is the end. Measuring conversions requires connecting the scan to what happens on the landing page afterward (more on how below).
4. Conversion rate (scans to outcome). Conversions divided by scans. This tells you how effective the code-to-outcome journey is. A low conversion rate with high scans points to a weak landing page or a mismatch between what the code promised and what it delivered.
5. Scan-to-page quality signals. Beyond the scan, what happens on the page: do people stay, or bounce immediately? High scans with instant bounces signal that the destination is not delivering what the code promised. This bridges QR data with your web analytics. See tracking QR codes in GA4.
The hierarchy to remember: Scans measure reach, conversions measure success. Always climb from "how many scanned" to "how many did what I wanted." A campaign is judged at the bottom of that funnel, not the top.
- Total scans: reach/awareness baseline only, never the whole story
- Unique vs repeat scans: a truer picture of distinct people reached
- Conversions: the metric that actually matters (sign-ups, sales, bookings)
- Conversion rate: scans-to-outcome, reveals landing-page effectiveness
- Post-scan quality (stay vs bounce): is the destination delivering?
The Dimensions That Add Meaning
The same scan data becomes far more useful when you break it down by dimension. These cuts turn a flat number into insight you can act on.
Timing (when scans happen). When people scan reveals a lot: time of day, day of week, and the campaign's arc over time. A spike after a specific push shows what drove attention; a steady tail shows lasting value. Timing helps you understand what triggered scans and when your audience engages. For most campaigns, watching scans over the campaign's life is more useful than a single total.
Location (where scans happen). For multi-placement or multi-location campaigns, where scans come from is gold. Which city, region, or, if you used distinct codes, which specific placement or location drove scans. This tells you which placements and markets are working.
Placement / source (which code drove scans). This is one of the most actionable cuts, and it depends on using distinct codes per placement. If you put a different code on the poster, the flyer, the packaging, and the social post, you can see exactly which channel drove scans, rather than lumping them together. This is how you learn where your audience actually engages.
Device and context. The overwhelming majority of scans are mobile (which is why the destination must be excellent on mobile), but device and browser data can still inform your landing-page optimization. See what analytics can track.
Why distinct codes matter so much: The location, placement, and source breakdowns only work if you use separate codes for separate placements. A single code everywhere gives you one undifferentiated number. Distinct codes per placement or channel are what unlock the "which one worked" insight that actually improves campaigns. This is the most important setup decision for campaign measurement.
Pro Tip
The most actionable campaign-analytics decision is made before launch: use a distinct QR code for each placement or channel (poster vs flyer vs packaging vs social). One shared code gives you a single meaningless total; separate codes tell you exactly which channel drove scans and conversions, which is what lets you double down on what works.
Connecting Scans to Real Outcomes
Since conversions are the metric that matters most, the key skill is connecting a scan to what happens afterward. Here is how to close that loop.
The scan is only half the journey. Your QR platform tells you about the scan; your web/analytics tools tell you what happened after. The full picture requires connecting the two. A scan that you cannot tie to an outcome is just a reach number.
Use UTM parameters and analytics. Add tracking parameters (UTMs) to the URLs your codes point to, so that when a scan lands on your site, your analytics (like GA4) attribute that visit, and any resulting conversion, to the QR campaign and specific code. This is how you measure conversions, not just scans. See how to track QR codes in Google Analytics 4.
Tie codes to specific goals. Decide before launch what outcome each code is meant to drive (a sign-up, a sale, a booking), and set up your analytics to measure that specific goal from the scan. A campaign measured against a clear goal is one you can actually judge.
Watch the whole funnel. The useful chain is: scans → landing-page visits → engagement → conversions. Watching where people drop off tells you what to fix. Lots of scans but few page visits can indicate a technical issue; lots of visits but few conversions points to the page or offer. See landing page best practices.
Dynamic codes are required for all of this. You can only track scans, attribute them, and connect them to outcomes with dynamic codes. Static codes give you no data at all. So campaign measurement starts with using dynamic, trackable codes. See dynamic vs static.
The honest note on measurement: Perfect attribution is hard (some conversions happen later, on other devices, etc.), so treat the numbers as strong directional signals rather than flawless truth. Directional data you act on beats perfect data you never collect. What matters is measuring consistently enough to compare and improve.
Turning Metrics Into Better Campaigns
Analytics only matter if they change what you do. Here is how to turn campaign metrics into decisions that improve results.
Compare placements and double down. Using your per-placement data, see which channels drove the most scans and, more importantly, conversions. Put more into what works and less into what does not. This is the most direct payoff of distinct-code tracking.
Fix the weak link in the funnel. If scans are high but conversions are low, the problem is usually the destination, improve the landing page, tighten the offer, or better match the page to what the code promised. If scans themselves are low, the problem is upstream: visibility, placement, or the call to action on the code.
Test and iterate. Because dynamic codes let you change destinations, you can A/B test: try different landing pages or offers and see which converts better, then keep the winner. See QR code A/B testing.
Use timing insights. If the data shows scans cluster at certain times or after certain pushes, time your future efforts accordingly.
Report on what matters. When reporting a campaign, lead with conversions and conversion rate, not just scans. Frame results around outcomes achieved for the cost, which is what actually demonstrates value. See QR code cost per scan and budgeting.
Build a baseline over time. Track campaigns consistently so you build benchmarks, what a "good" scan and conversion rate looks like for you. Over time, this baseline makes each new campaign easier to judge and improve.
The bottom line: QR campaign analytics is not about collecting scans; it is about climbing from scans to conversions, breaking data down by placement and time to see what works, connecting scans to real outcomes with proper tracking, and then acting on it, doubling down on winners and fixing weak links. Do that, and each campaign teaches you how to make the next one better, which is the entire point of measurement.
Conclusion
Scan count is where QR campaign measurement starts, not where it ends. The metrics that actually matter climb from reach to results: unique versus repeat scans, and above all conversions and conversion rate, the numbers that tell you whether the campaign achieved its goal, not just that people looked. A code with huge scans and no conversions failed; the funnel, not the top number, is the verdict.
The same data becomes insight when you break it down, by timing, location, and especially placement or source, which is why using a distinct code per channel is the most important setup decision you can make. And because conversions are what matter, the key skill is connecting scans to outcomes with UTM parameters and analytics, so you measure results, not just reach. All of this requires dynamic, trackable codes.
Most importantly, act on the metrics: double down on the placements that convert, fix the weak link in the funnel, test and iterate on destinations, and report on conversions rather than scans. Measure consistently and each campaign teaches you how to make the next one better, which is the whole reason to track at all.
Related reading:
Run measurable QR campaigns with QRForever. Start a 7-day full-access trial, no credit card needed. Distinct trackable codes per placement, with analytics that go beyond scan counts.
Explore QRForever Solutions
Ready to Create Your Own QR Codes?
Start creating dynamic QR codes for your business today. Track analytics, update content anytime, and never reprint again.
Related Articles
QR Code Analytics: Understanding and Using Scan Data (Updated 2026)
Master QR code analytics to measure campaign success in 2026. Learn which metrics matter, how to interpret data, and how to turn scan trends into operational improvements.
QR Code Analytics Explained: What Data Can You Actually Track? (2026)
A complete breakdown of QR code tracking capabilities: scan counts, location data, device types, time patterns, and how to use analytics to improve real marketing campaigns. Updated September 2026.
How to Track QR Code Scans Without an App (2026 Methods)
You don't need a special app to track QR code scans, but you do need the right type of QR code. Here's exactly how QR scan tracking works, what you can measure, and how to set it up in minutes.