How to Track QR Codes in Google Analytics 4 (UTM Parameter Guide 2026)
QR platform analytics tell you scans happened. Google Analytics 4 tells you what those scanners did next. The bridge is UTM parameters. Here is exactly how to track QR code campaigns end to end in GA4.


There are two kinds of QR code data, and understanding the difference is the key to this whole topic. Your QR platform tells you that a scan happened: how many, roughly where, on what device. Google Analytics 4 tells you what the person did after they landed on your website: which pages they viewed, how long they stayed, and whether they completed the action you care about.
Most businesses only look at the first kind and miss the second, which is where the real insight lives. A scan is not a success. A scan that leads to a purchase, a signup, or a booking is. To see that, you need to connect your QR codes to GA4, and the bridge that connects them is UTM parameters.
This guide explains exactly how to track QR code campaigns end to end in GA4: what UTM parameters are, how to build them for QR codes, how to see the data in GA4, and how to use it. It assumes no prior analytics expertise and stays practical. It complements our analytics explained guide and how to track scans without an app, going deeper specifically on the GA4 integration.
Why QR Platform Analytics Are Not Enough
QR platform analytics are genuinely useful, but they stop at the moment of the scan. Understanding what they do and do not tell you clarifies why GA4 matters.
What your QR platform tells you:
- How many scans, and when
- Approximate location (city level, from IP)
- Device type, operating system, browser
- Unique versus repeat scans, approximately
This answers "is my QR code being scanned, and by roughly whom." That is valuable for judging placement and reach.
What your QR platform cannot tell you:
- What the person did after landing on your site
- Whether they viewed your product, your pricing, your contact page
- How long they stayed and how many pages they saw
- Whether they completed a purchase, a signup, a booking, or any goal
- How QR traffic compares to your other traffic sources in behavior and conversion
This second set is where marketing decisions actually get made. A campaign that drives lots of scans but no conversions is failing, and QR platform analytics alone would make it look like a success.
The complete picture requires both:
- QR platform analytics: the scan happened (the top of the funnel)
- GA4: what happened after (the rest of the funnel, including the conversion)
Connecting them gives you the full journey from scan to outcome, and that is what lets you judge and improve a QR campaign properly.
What UTM Parameters Are (in Plain Terms)
UTM parameters are the mechanism that lets GA4 recognize traffic as coming from your QR code specifically. They are simpler than they sound.
What they are: UTM parameters are small pieces of text added to the end of a URL that tell Google Analytics where the visit came from. They are invisible to the user's experience and simply travel along with the link.
A URL without UTM parameters: `https://yoursite.com/menu`
The same URL with UTM parameters: `https://yoursite.com/menu?utm_source=qr_code&utm_medium=table_tent&utm_campaign=summer_menu`
Everything after the `?` is UTM parameters. When someone visits that tagged URL, GA4 reads the tags and files the visit under that source, medium, and campaign.
The main UTM parameters:
- utm_source: where the traffic came from. For QR, something like `qr_code` or the specific placement.
- utm_medium: the type of channel. For QR, often `qr` or the physical medium like `table_tent`, `poster`, `packaging`.
- utm_campaign: the specific campaign, like `summer_menu_2026` or `trade_show_june`.
- utm_content (optional): to distinguish variants, useful for A/B testing, like `design_a` versus `design_b`.
- utm_term (optional): originally for paid search keywords, rarely needed for QR.
How this connects to your QR code: You put the UTM-tagged URL as your QR code's destination. When someone scans and lands on your site, GA4 sees the tags and knows the visit came from that specific QR code and campaign. That is the entire mechanism.
The key requirement: Use a dynamic QR code, so you can set and adjust the tagged destination URL without regenerating the code. A static code would lock the URL, UTM tags and all, permanently. See dynamic vs static QR codes.
Pro Tip
Keep your UTM naming consistent and simple, and write it down. Decide once that QR codes always use utm_medium=qr, use lowercase, and separate words with underscores. Inconsistent tags (qr vs QR vs qr-code) fragment your data in GA4 into separate buckets that should have been one. Consistency is the whole game.
Step by Step: Setting Up QR Tracking in GA4
Here is the complete process from building the tagged URL to seeing the data.
Step 1: Confirm GA4 is on your site. Your destination website needs Google Analytics 4 installed and working. If it is not, that is the prerequisite, since GA4 can only track what happens on a site it is measuring.
Step 2: Build your UTM-tagged URL. Take your destination URL and add UTM parameters. You can write them by hand following the format above, or use Google's Campaign URL Builder, a free tool that assembles the tagged URL for you from fields you fill in. The builder is the safer route because it formats everything correctly.
Example result: `https://yoursite.com/promo?utm_source=qr_code&utm_medium=poster&utm_campaign=july_launch`
Step 3: Create a dynamic QR code pointing to the tagged URL. Generate a dynamic QR code with the UTM-tagged URL as its destination. Dynamic matters because you may want to adjust the URL later, and because you also get the QR platform's own scan analytics alongside GA4.
Step 4: Deploy and let data flow. Place your QR code as normal. As people scan and land on the tagged URL, GA4 begins recording those visits under your campaign.
Step 5: Find the data in GA4. In GA4, traffic acquisition and campaign reports show visits broken down by source, medium, and campaign. Look for the source, medium, and campaign values you set. You will see your QR traffic as its own segment, with all the behavioral data GA4 captures: pages viewed, engagement, and conversions.
Step 6: Track conversions. Ensure the actions you care about (purchases, signups, bookings, form submissions) are set up as conversions in GA4. Then you can see not just that QR traffic arrived, but whether it converted, which is the entire point.
A common first-time issue: If you do not see your QR traffic, the usual causes are: GA4 not actually installed on the destination, a typo in the UTM tags, or simply not enough time or scans yet for data to appear. Test by scanning your own code and checking the GA4 realtime report, which shows active users and their source immediately.
- Confirm GA4 is installed on your destination site
- Build a UTM-tagged URL (use Google's Campaign URL Builder)
- Create a dynamic QR code pointing to the tagged URL
- Deploy the code and let visits flow
- View traffic by source/medium/campaign in GA4 acquisition reports
- Set up your key actions as GA4 conversions to measure outcomes
Using the Data: From Numbers to Decisions
Setting up tracking is only worth it if you use what it tells you. Here is how the combined QR-plus-GA4 data drives real decisions.
Compare placements by outcome, not just scans. Give each placement its own UTM (utm_medium=table_tent versus utm_medium=poster versus utm_medium=receipt). Now GA4 shows not just which placement got the most scans, but which got the most conversions. A placement with fewer scans but higher conversion may be more valuable, and you would never know from scan counts alone.
Judge campaigns by the full funnel. A campaign that drove 500 scans and 2 conversions is failing, regardless of how good the scan count looks. GA4 reveals this. You can then diagnose where the drop-off is: are people landing and leaving immediately (bad destination), or engaging but not converting (bad offer or checkout)?
Compare QR traffic to your other sources. GA4 puts QR traffic alongside your organic, direct, and paid traffic. You can see whether QR visitors behave differently, convert better or worse, and are worth the investment relative to other channels.
Diagnose the destination. If QR traffic arrives but bounces immediately, the problem is usually the landing page: slow, not mobile-optimized, or not matching what the code promised. GA4's engagement data points you straight at this. See the psychology of QR code scanning for why the post-scan experience matters so much.
Attribute offline marketing. This is the deeper value. QR codes with GA4 tracking let you measure the online impact of offline marketing, which is normally invisible. A poster, a flyer, a packaging insert, a trade show booth, all become measurable channels with real conversion data. That turns "we think the flyers work" into "the flyers drove this many conversions."
The decision loop: Deploy with UTMs, watch scans in your QR platform and outcomes in GA4, identify what converts, and shift toward it. Kill placements that scan but do not convert. Double down on ones that do. That loop, powered by connecting QR codes to GA4, is how QR marketing gets genuinely optimized rather than guessed.
Conclusion
QR platform analytics tell you a scan happened. Google Analytics 4 tells you whether that scan turned into anything worth having. Connecting the two, using UTM parameters as the bridge, gives you the complete journey from scan to conversion, and that complete picture is what separates a QR campaign you can actually optimize from one you are merely guessing about.
The setup is straightforward: confirm GA4 is on your site, build UTM-tagged URLs (Google's Campaign URL Builder makes this safe), point dynamic QR codes at them, and read the results in GA4's acquisition and conversion reports. Keep your UTM naming consistent, give each placement its own tag, and make sure your key actions are set up as conversions.
Do this and offline marketing stops being a black box. Every poster, packaging insert, and booth becomes a measurable channel with real conversion data, and you can finally judge your QR codes by what they actually achieve rather than by how many times they were scanned.
Related reading:
Create trackable dynamic QR codes with QRForever. Start a 7-day full-access trial, no credit card needed. Point them at UTM-tagged URLs and get both scan analytics and full GA4 measurement.
Explore QRForever Solutions
Ready to Create Your Own QR Codes?
Start creating dynamic QR codes for your business today. Track analytics, update content anytime, and never reprint again.
Related Articles
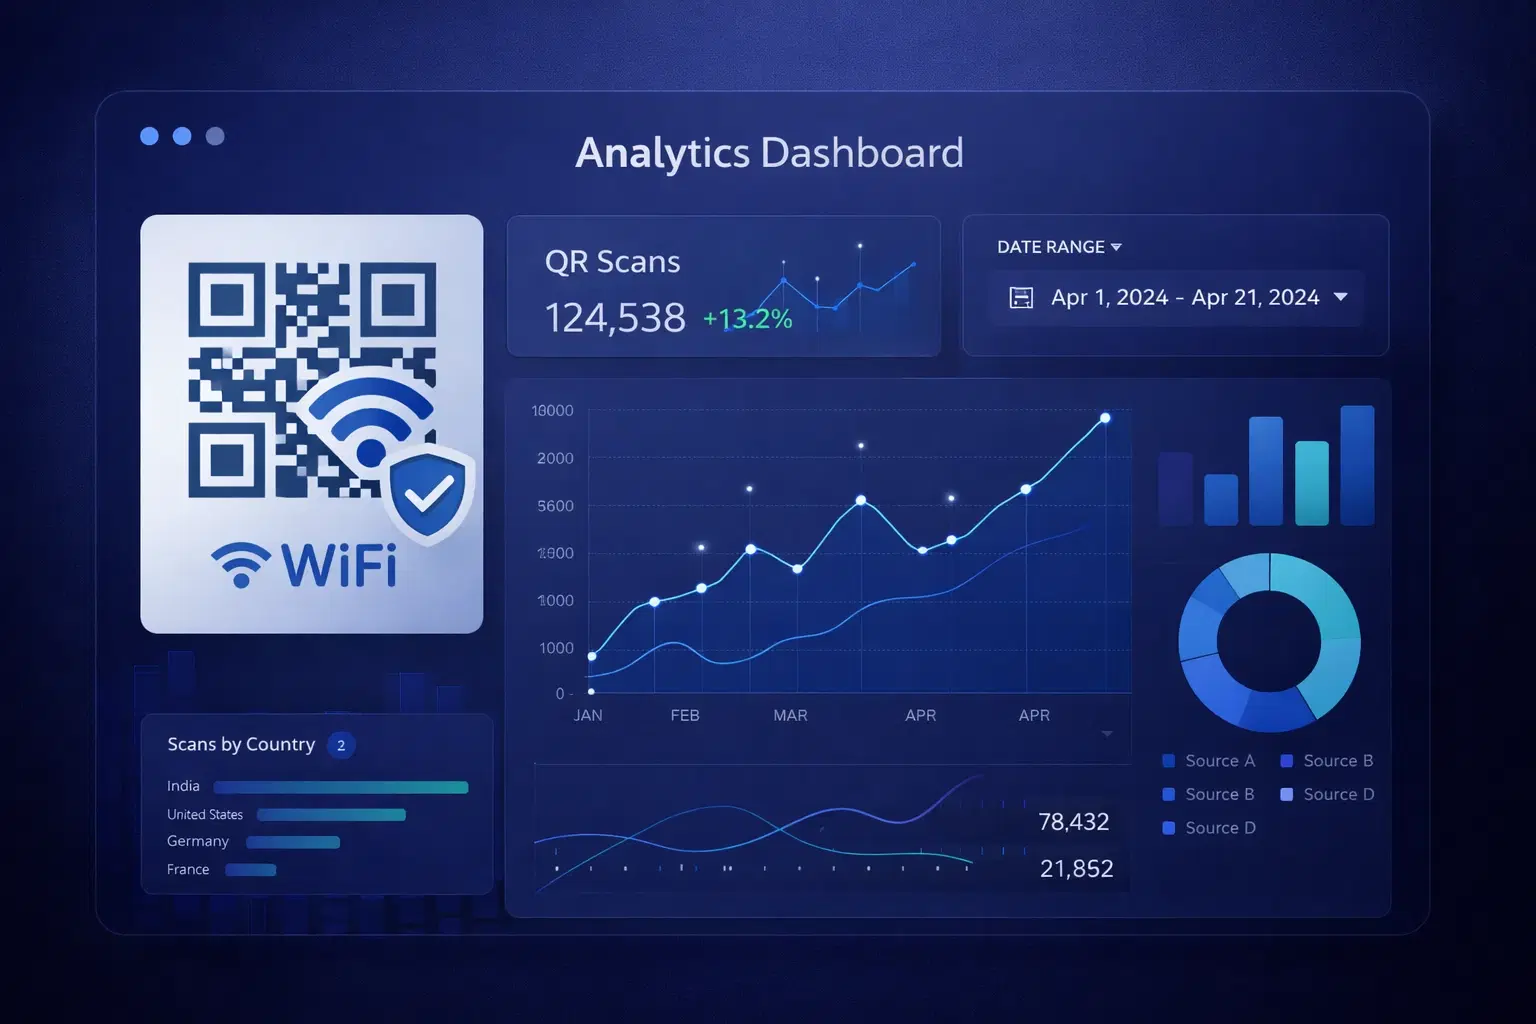
QR Code Analytics: Understanding and Using Scan Data (Updated 2026)
Master QR code analytics to measure campaign success in 2026. Learn which metrics matter, how to interpret data, and how to turn scan trends into operational improvements.
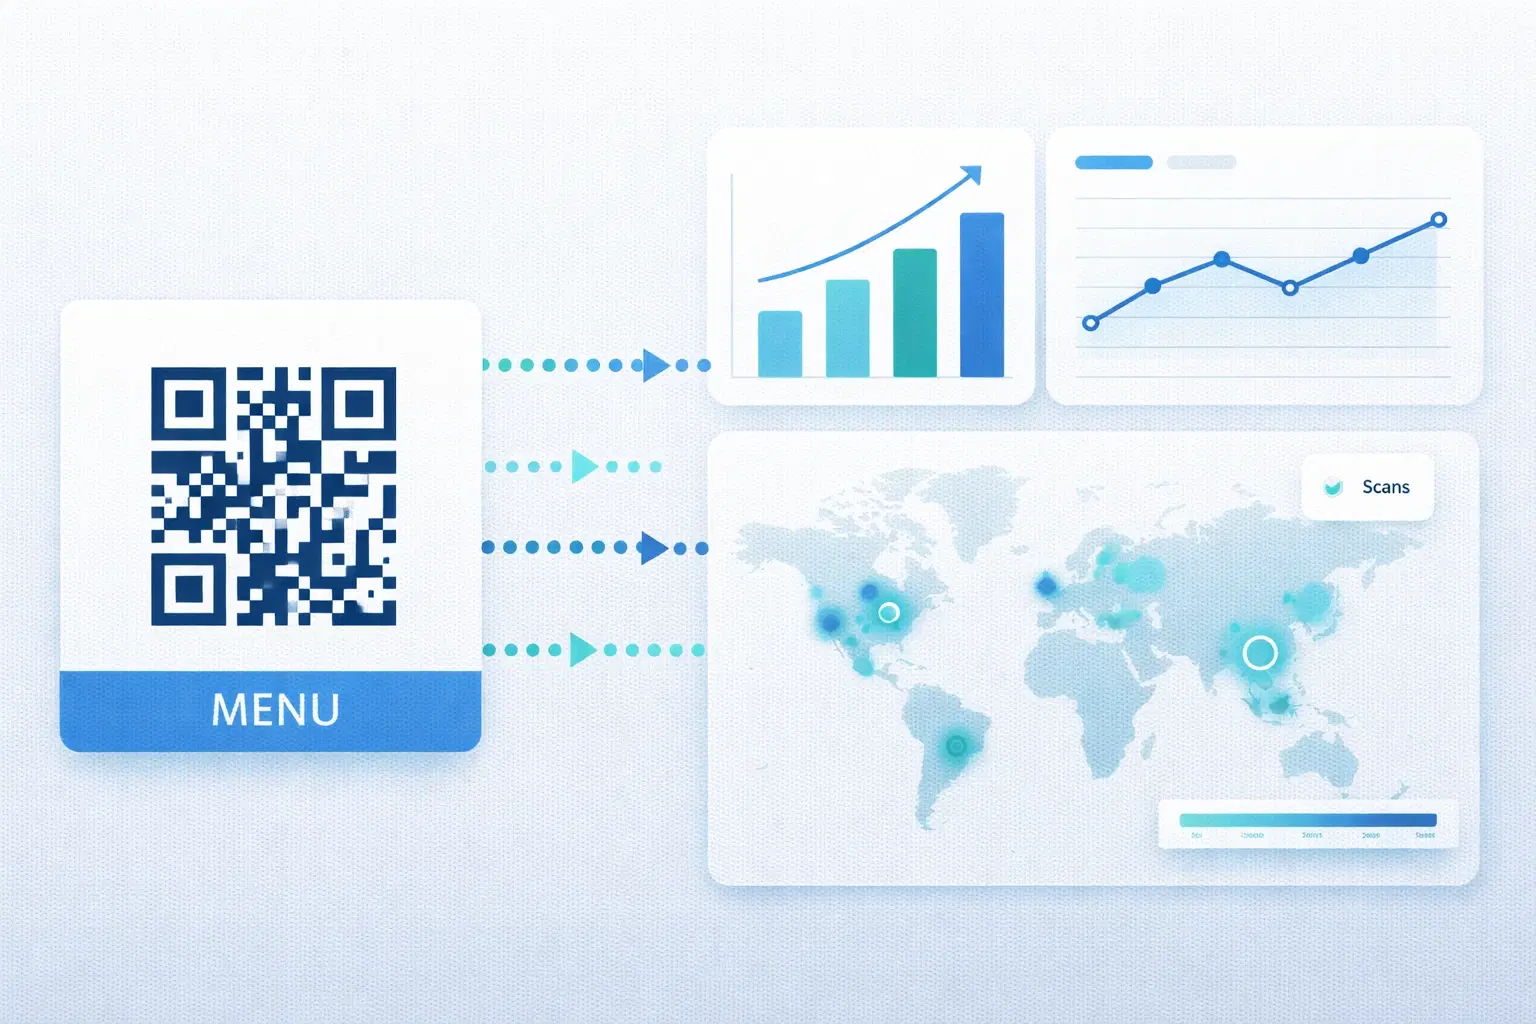
QR Code Analytics Explained: What Data Can You Actually Track? (2026)
A complete breakdown of QR code tracking capabilities: scan counts, location data, device types, time patterns, and how to use analytics to improve real marketing campaigns. Updated September 2026.
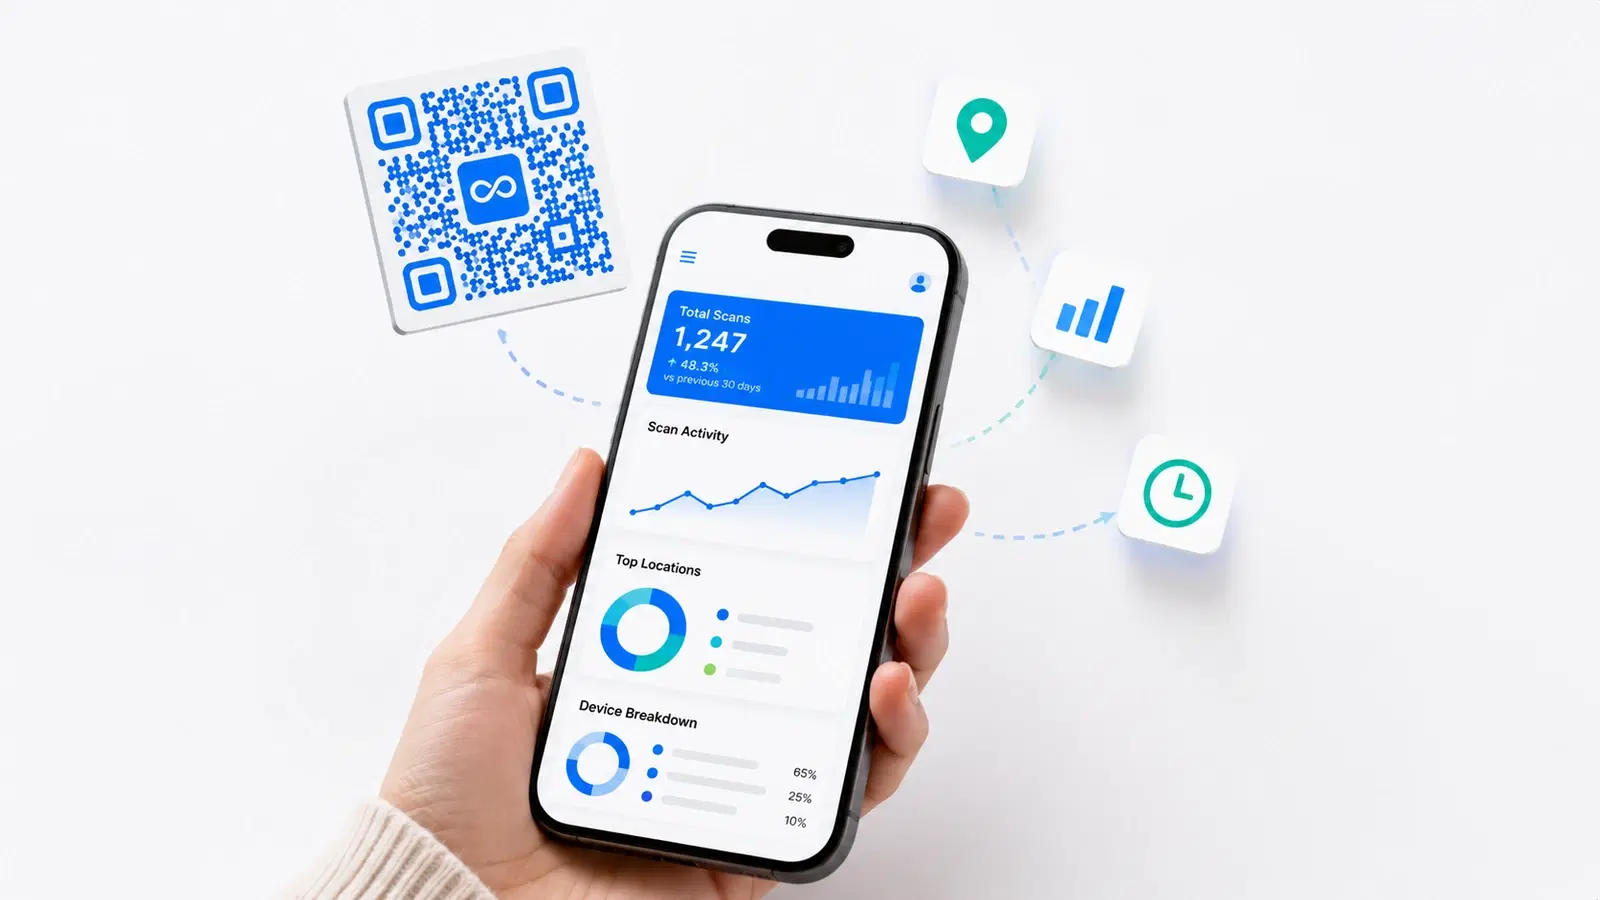
How to Track QR Code Scans Without an App (2026 Methods)
You don't need a special app to track QR code scans, but you do need the right type of QR code. Here's exactly how QR scan tracking works, what you can measure, and how to set it up in minutes.