QR Code Analytics & Scan Tracking
Track every scan with powerful analytics. Know who, when, where, and how people interact with your QR codes.
Powerful Analytics Dashboard
Track every scan with detailed insights. Understand your audience and optimize performance.
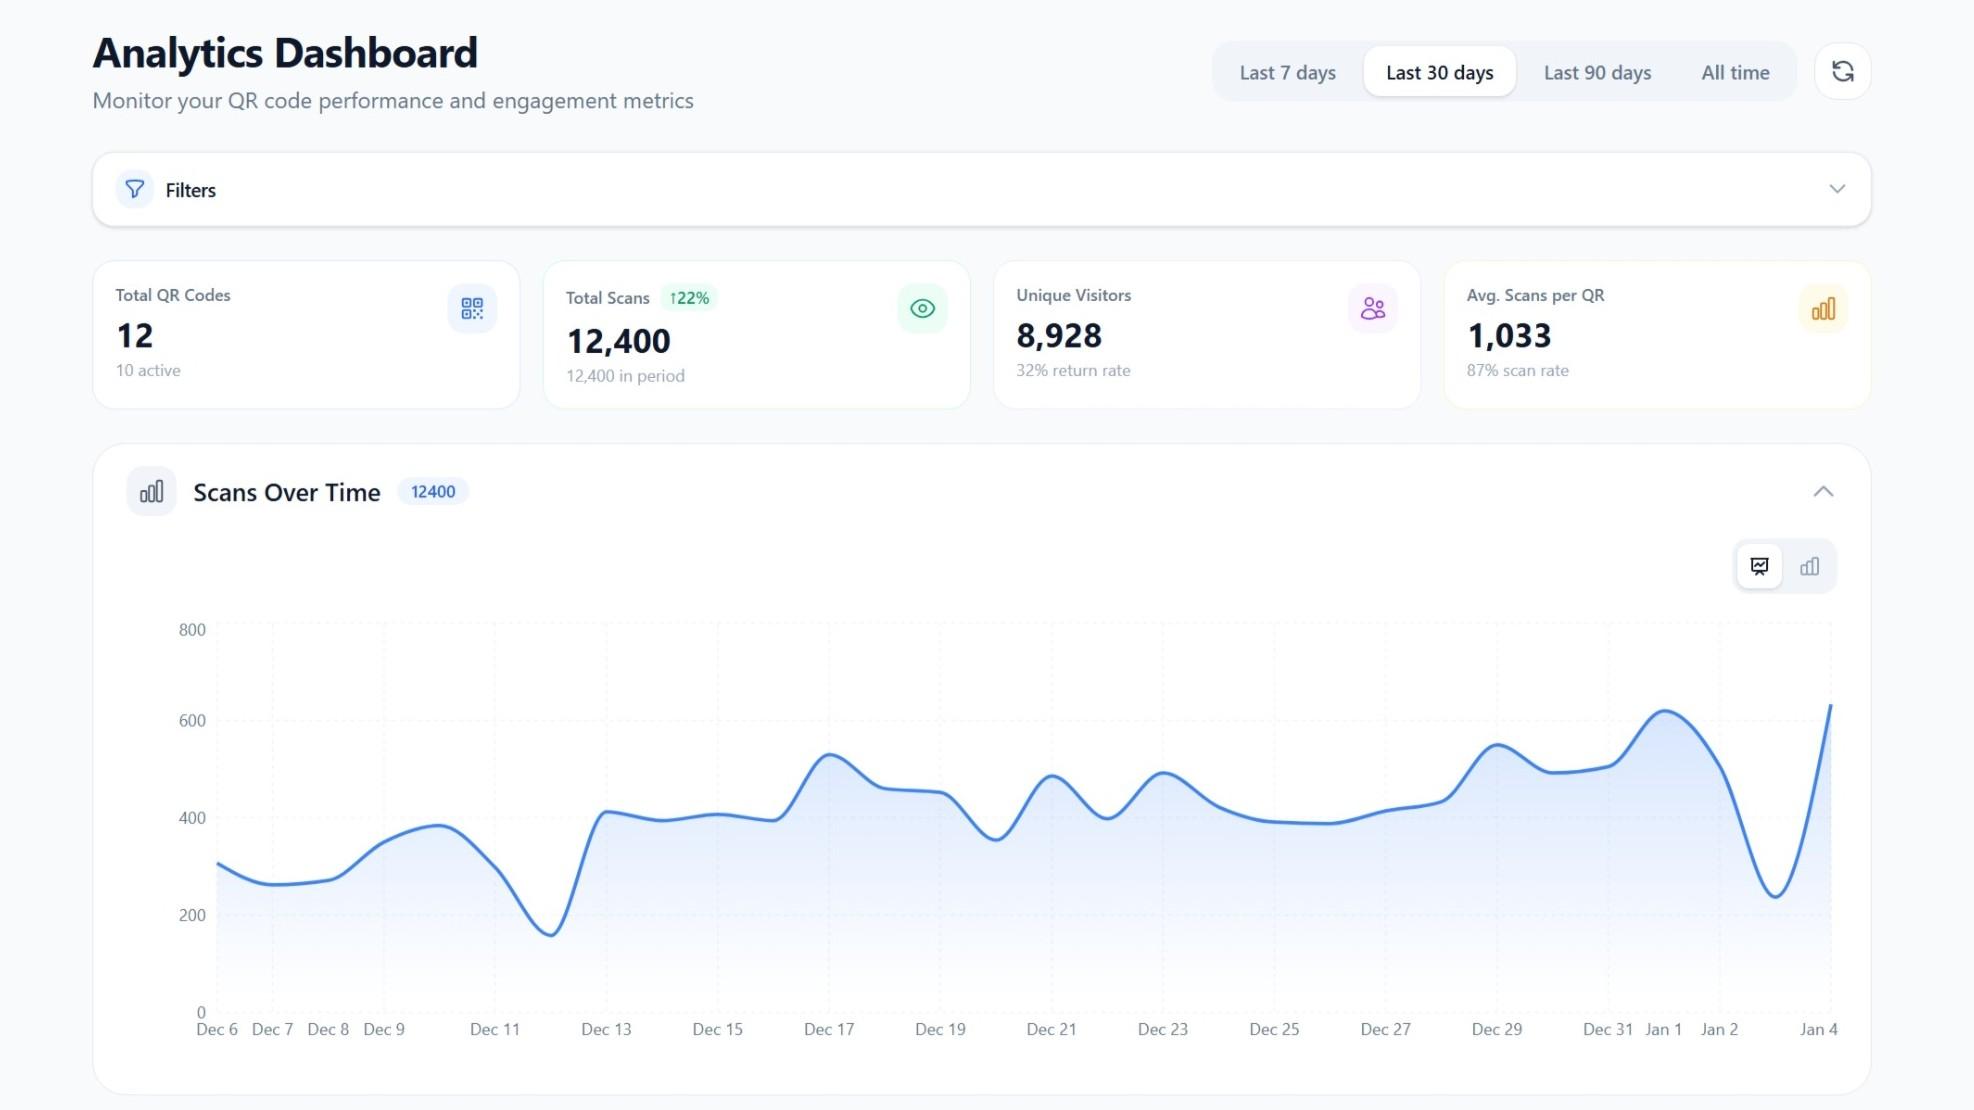
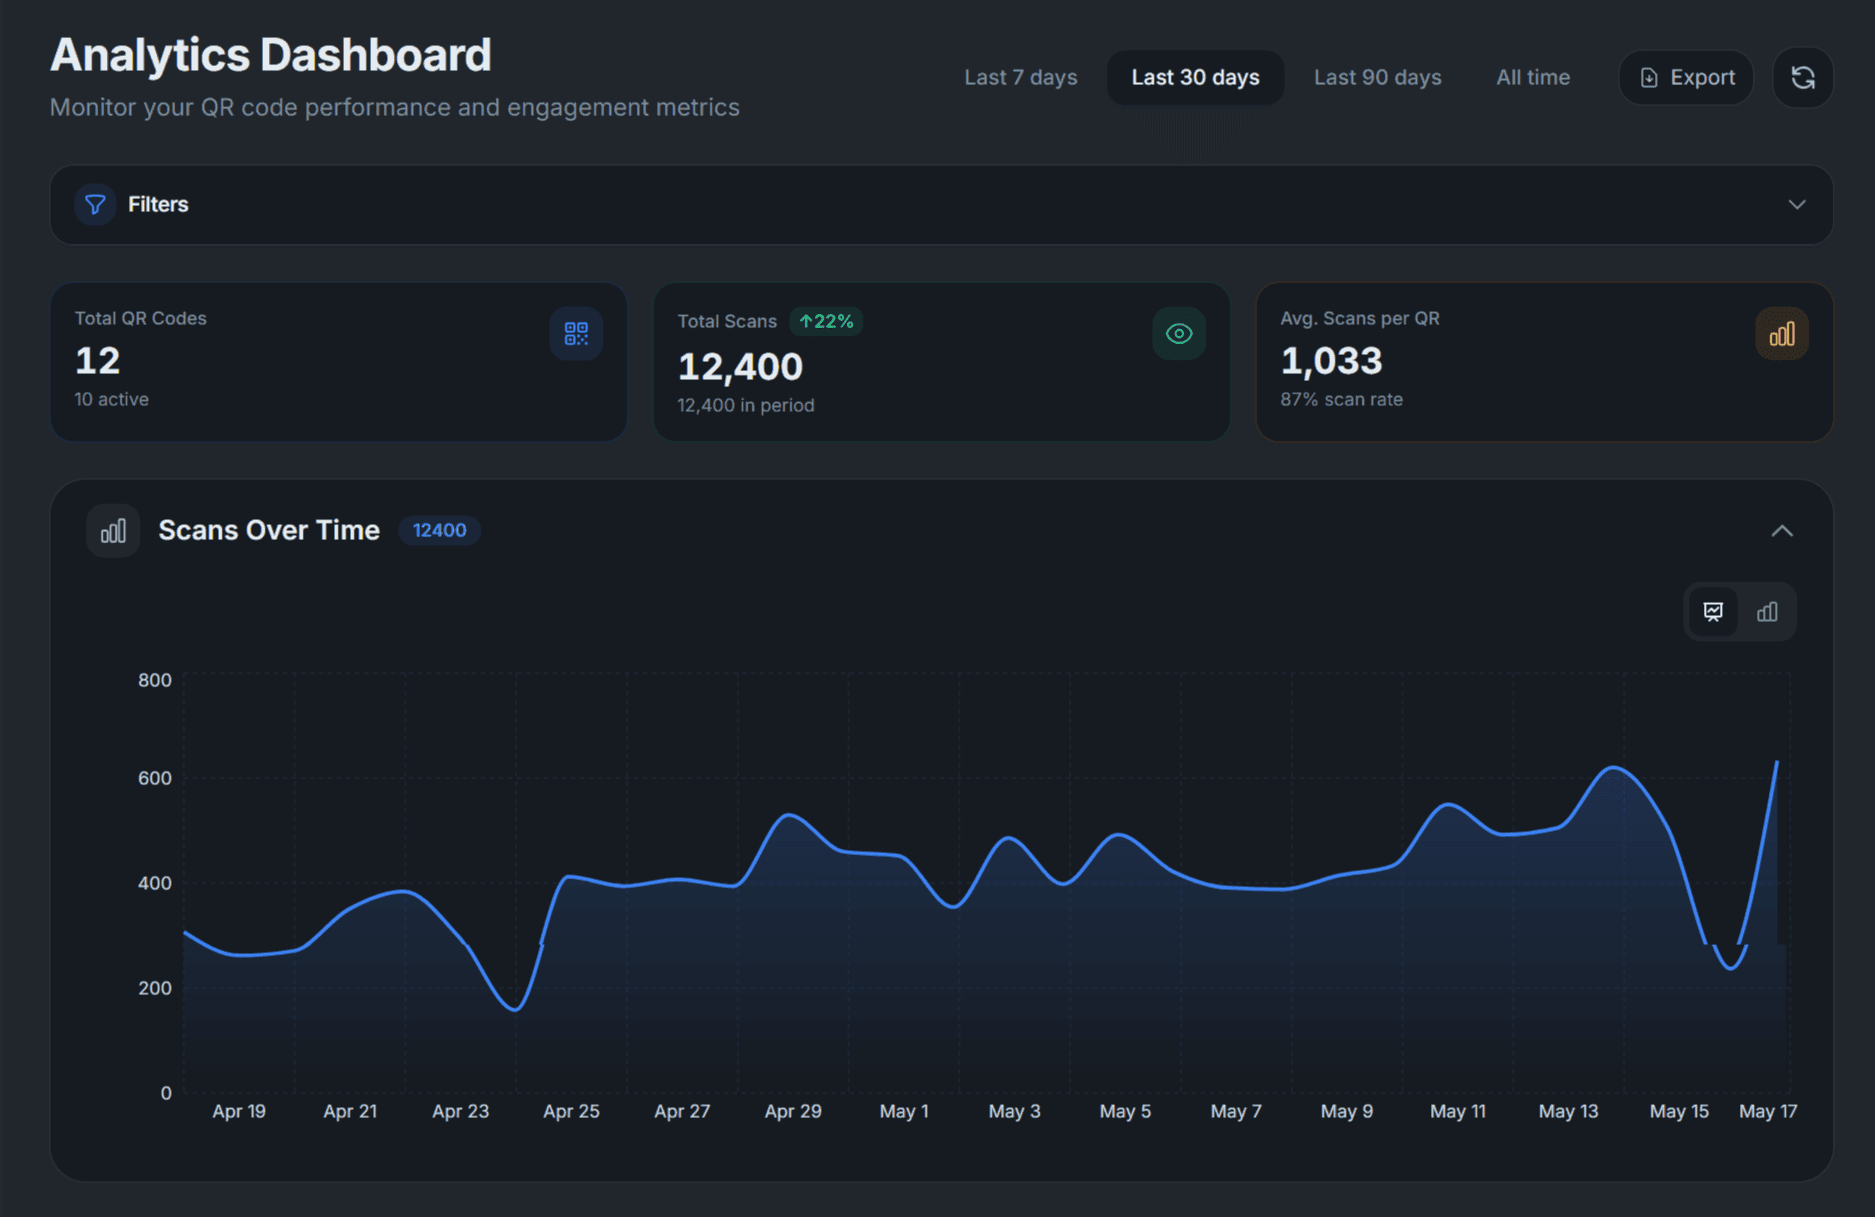
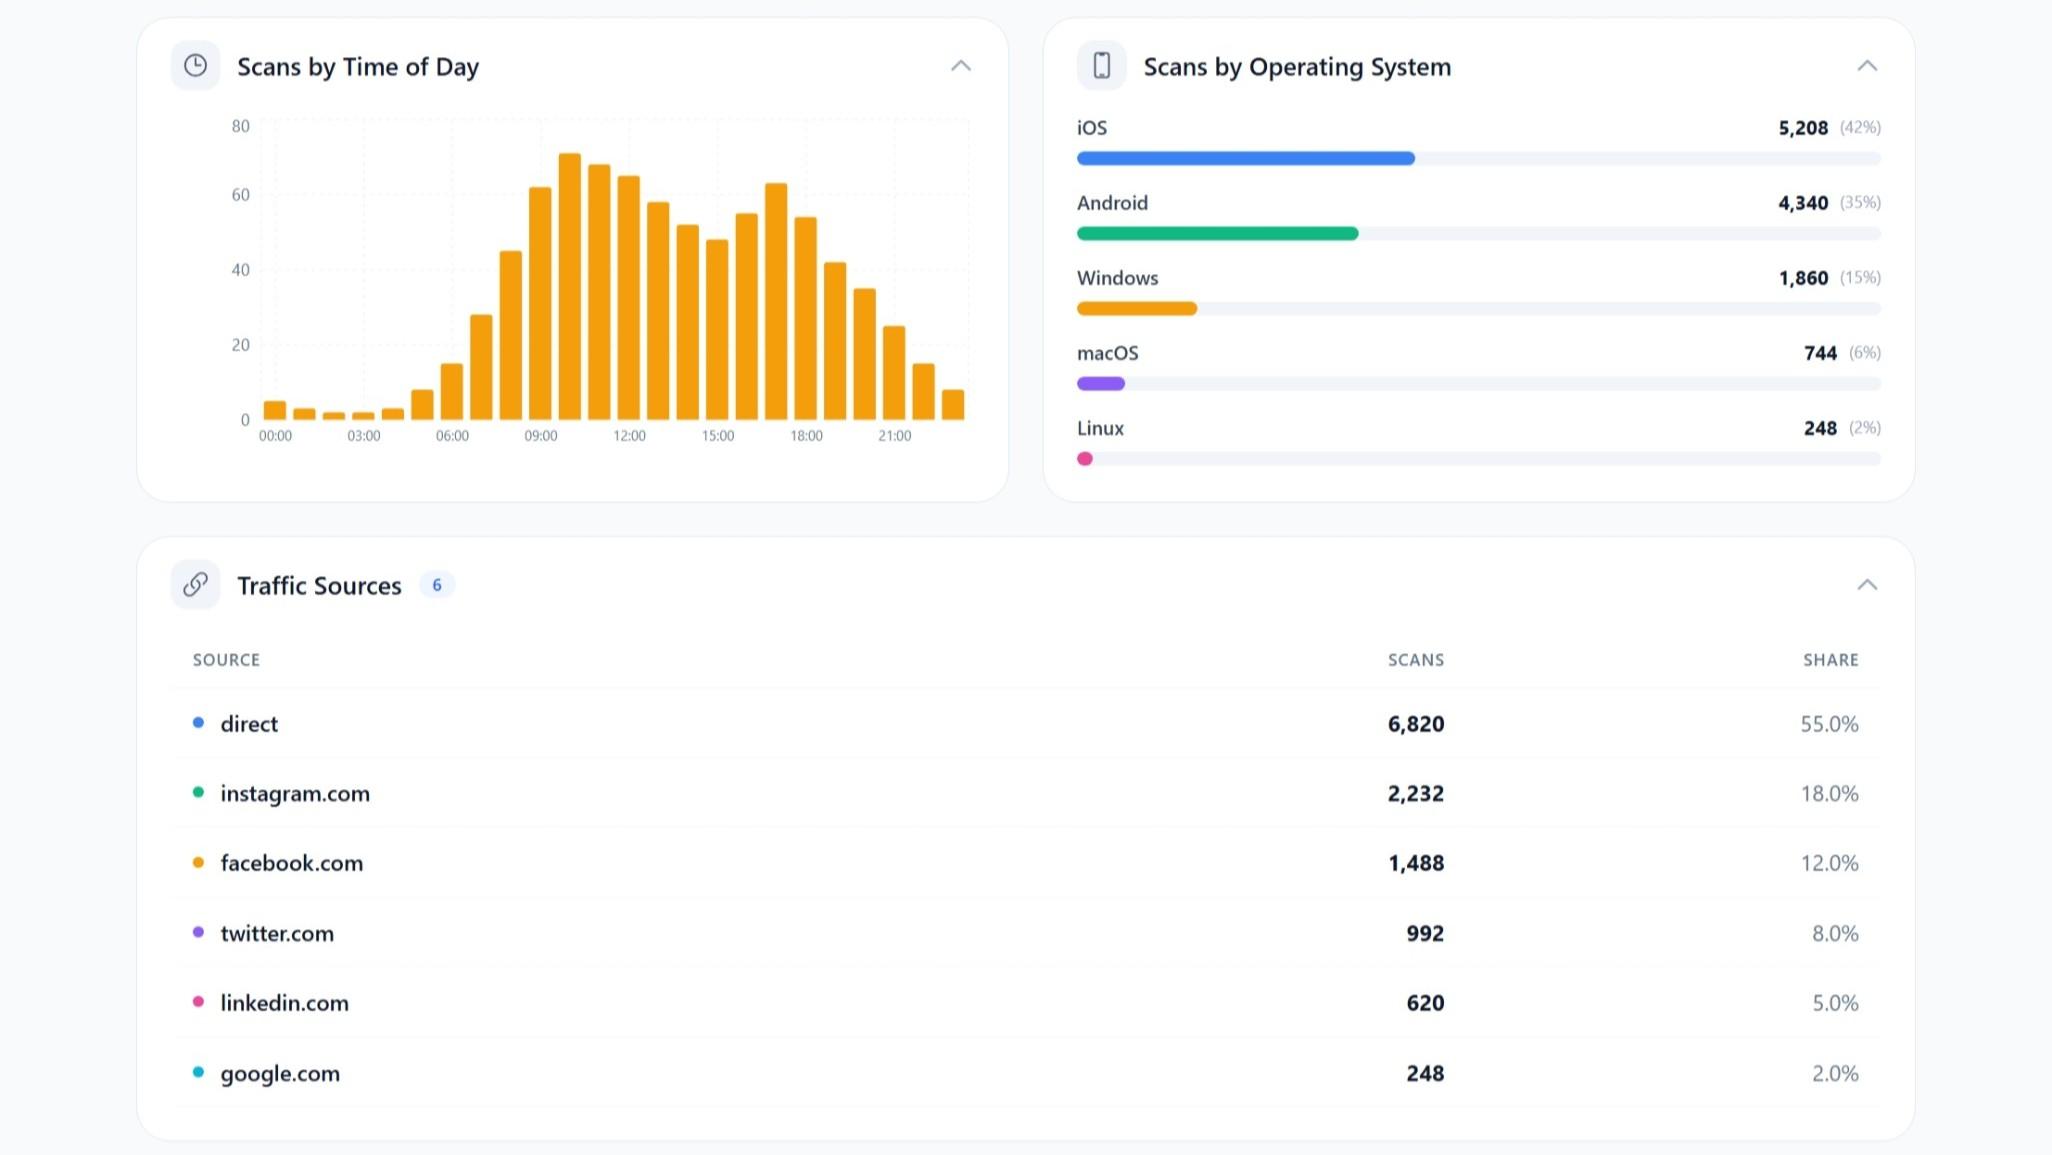
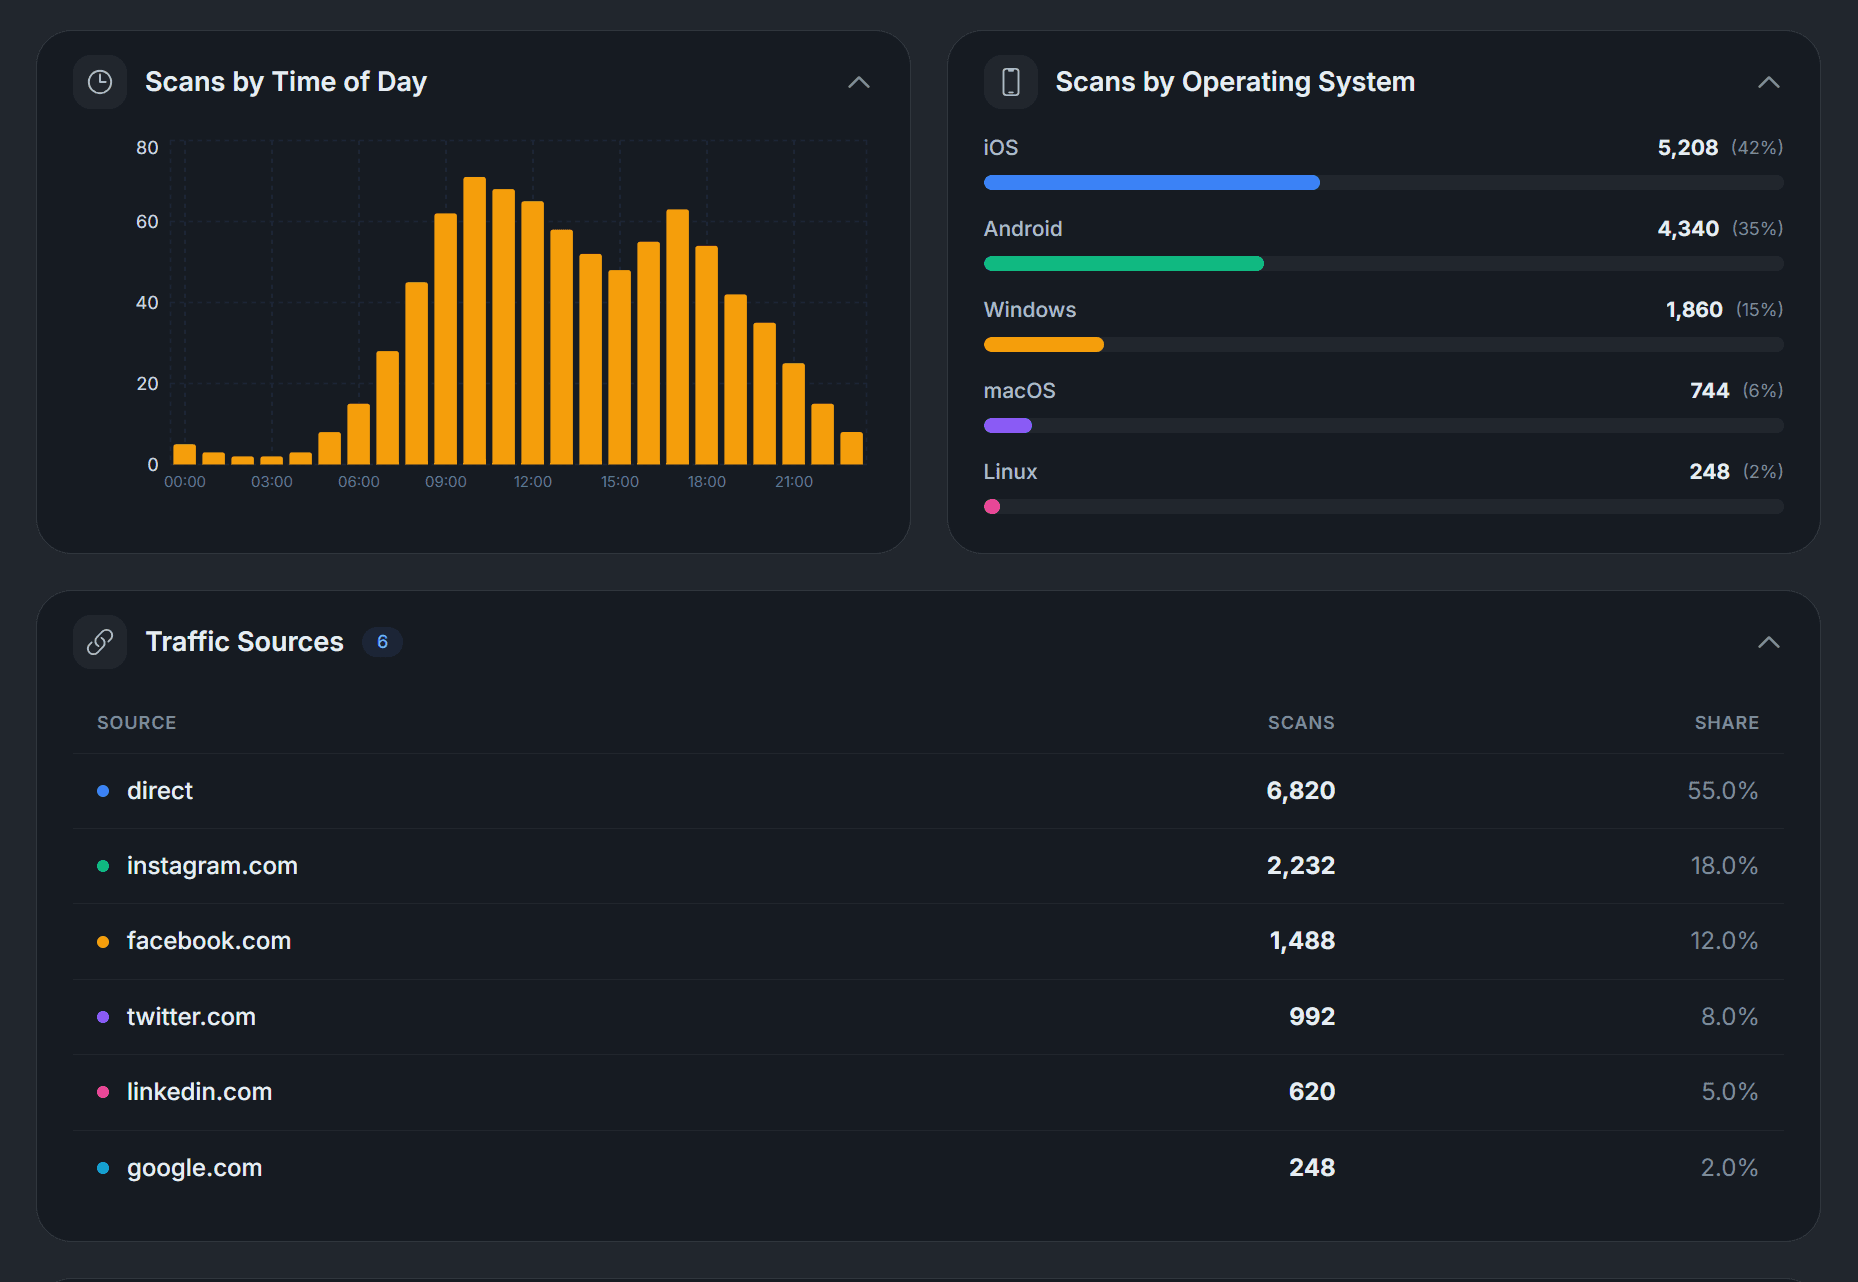
Scan Metrics
Total scans, unique scans, and scan trends over time
Device Breakdown
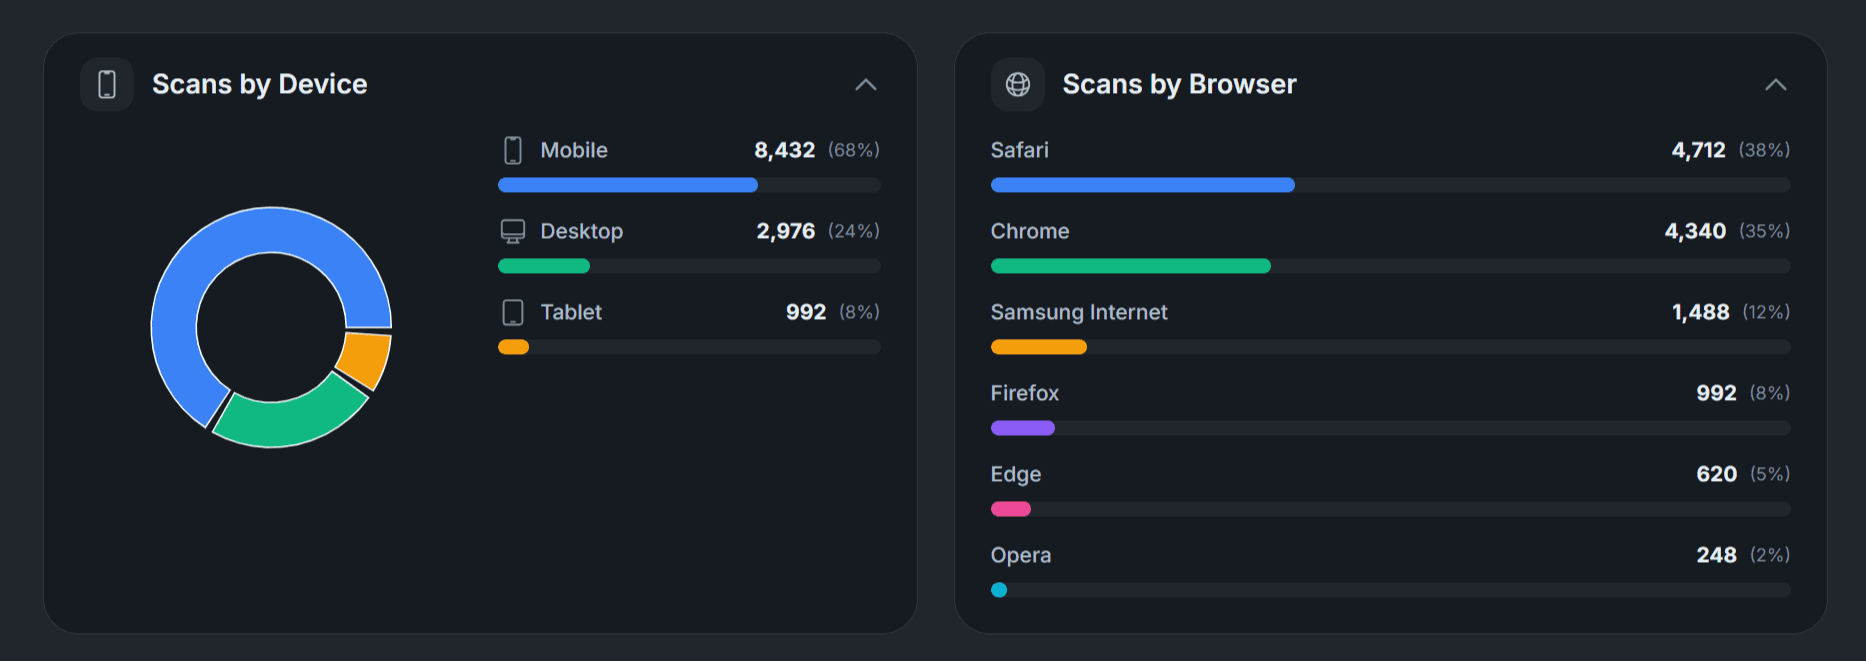
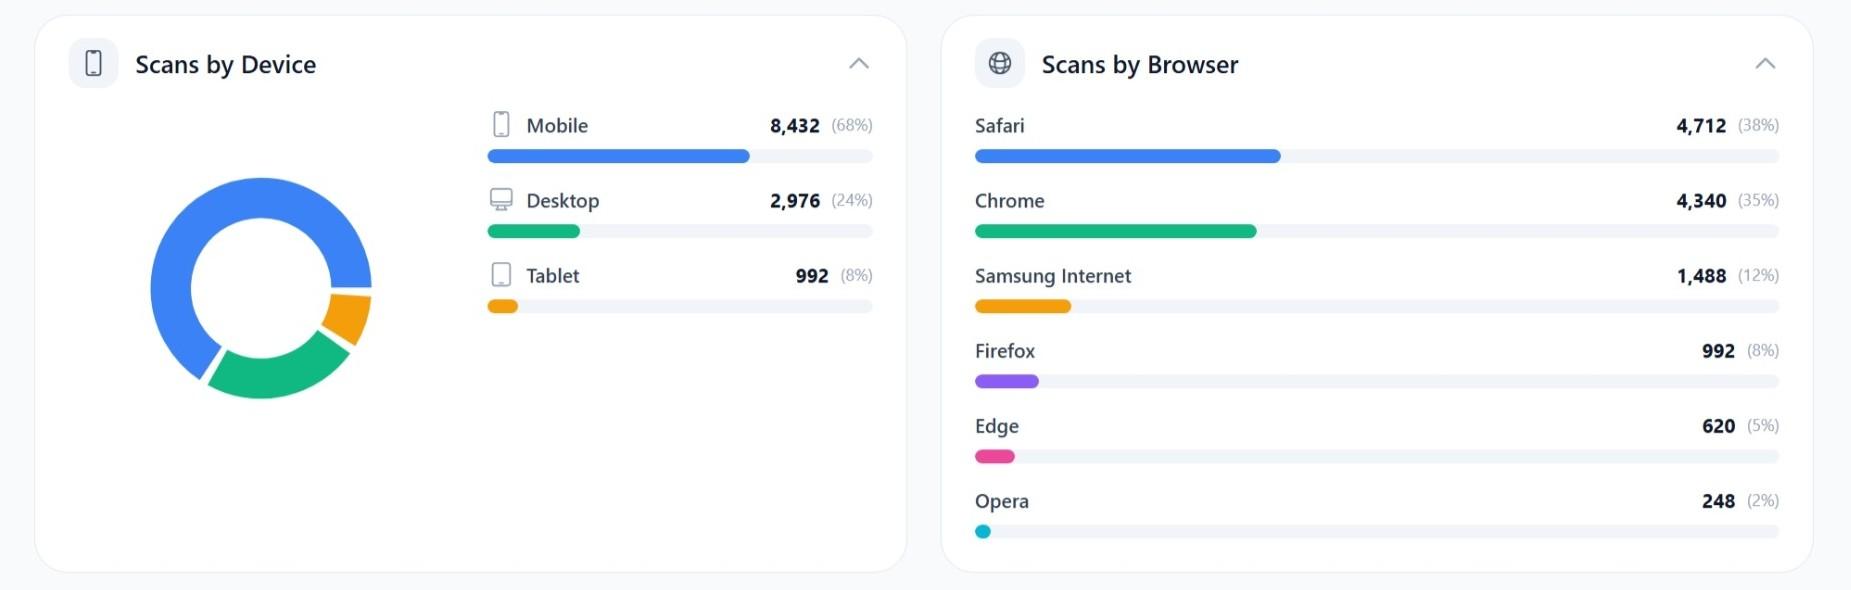
See which devices your audience uses most
Location Maps
Geographic data showing where scans happen
Time Analytics
Peak hours, days, and scanning patterns
Real-time
Live tracking updates
Unlimited
No data retention limits
Export
Download CSV reports
7-day free trial • No credit card required
What Is QR Code Analytics?
QR code analytics refers to the data collected each time someone scans a dynamic QR code. When a user scans a dynamic code, their scan is routed through a redirect server before reaching the destination URL. That server-side step is what captures the analytics data.
Static QR codes, like those generated by free static tools, cannot be tracked. The URL is baked into the pattern. There is no server redirect, so there is no event to log. Learn more in our guide to dynamic vs static QR codes.
Dynamic QR codes include a redirect step. Every scan hits QRForever's servers first, logging the event, then redirects the user to the destination in under 300ms.
What Data Is Captured Per Scan?
Every scan on a dynamic QRForever code adds a row to your analytics. Here is exactly what each scan records:
| Data point | What it tells you |
|---|---|
| Total scans | Overall engagement volume |
| Unique visitors | Deduplicated reach, so the same person is not counted twice |
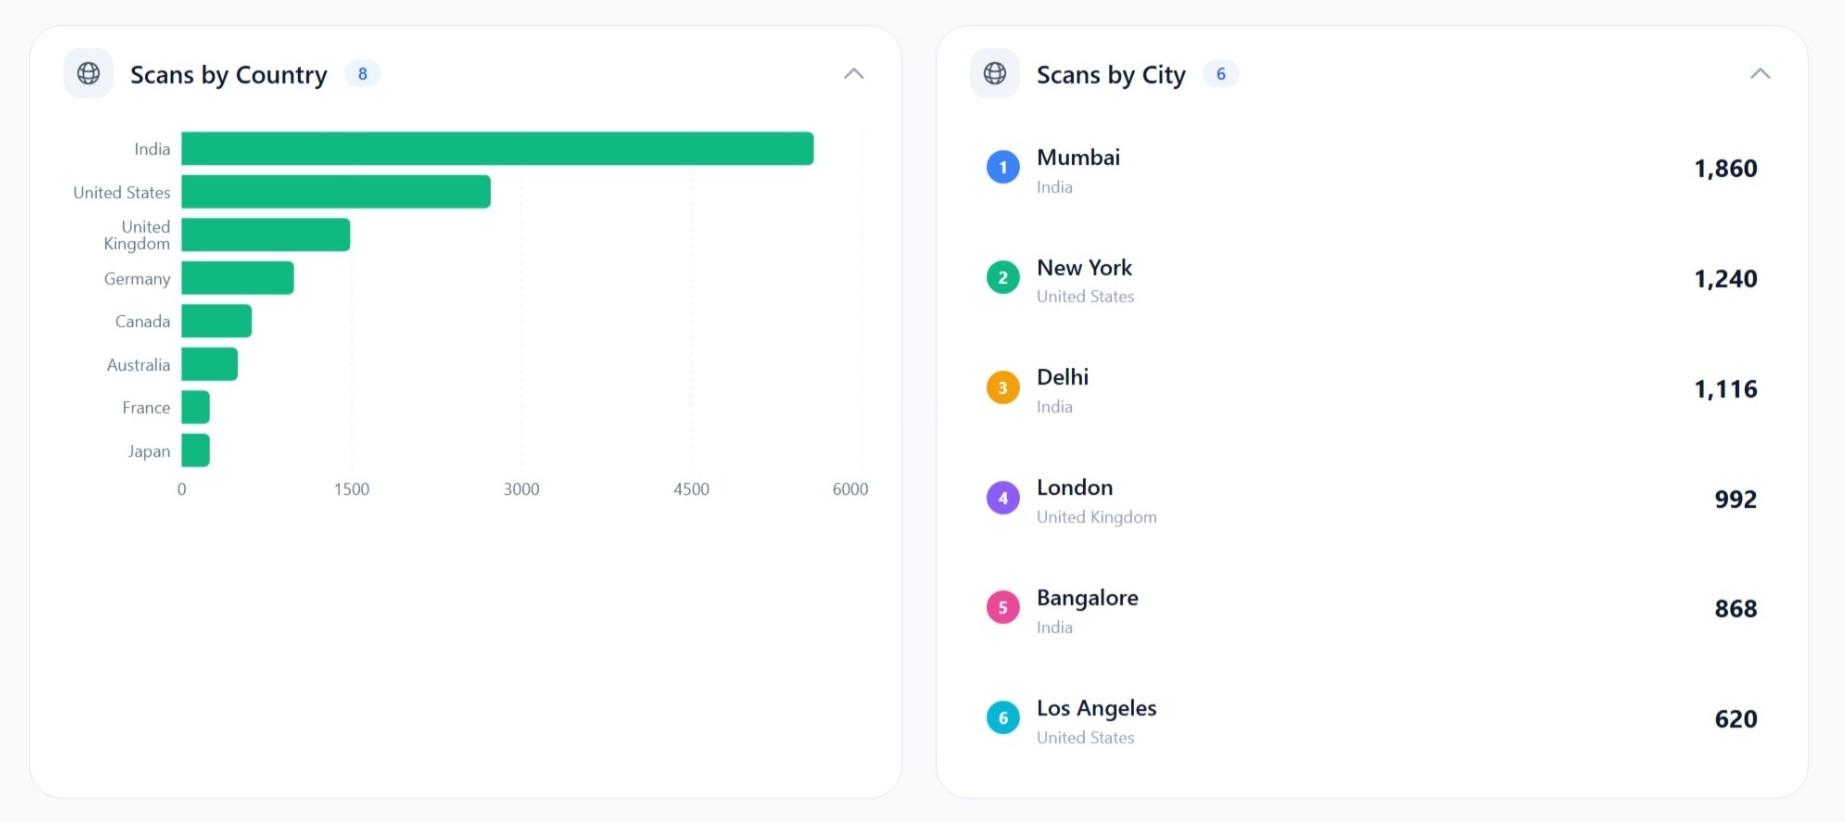
| Country | Geographic origin of the scan |
| City | Regional targeting data |
| Device type | Mobile vs tablet vs desktop |
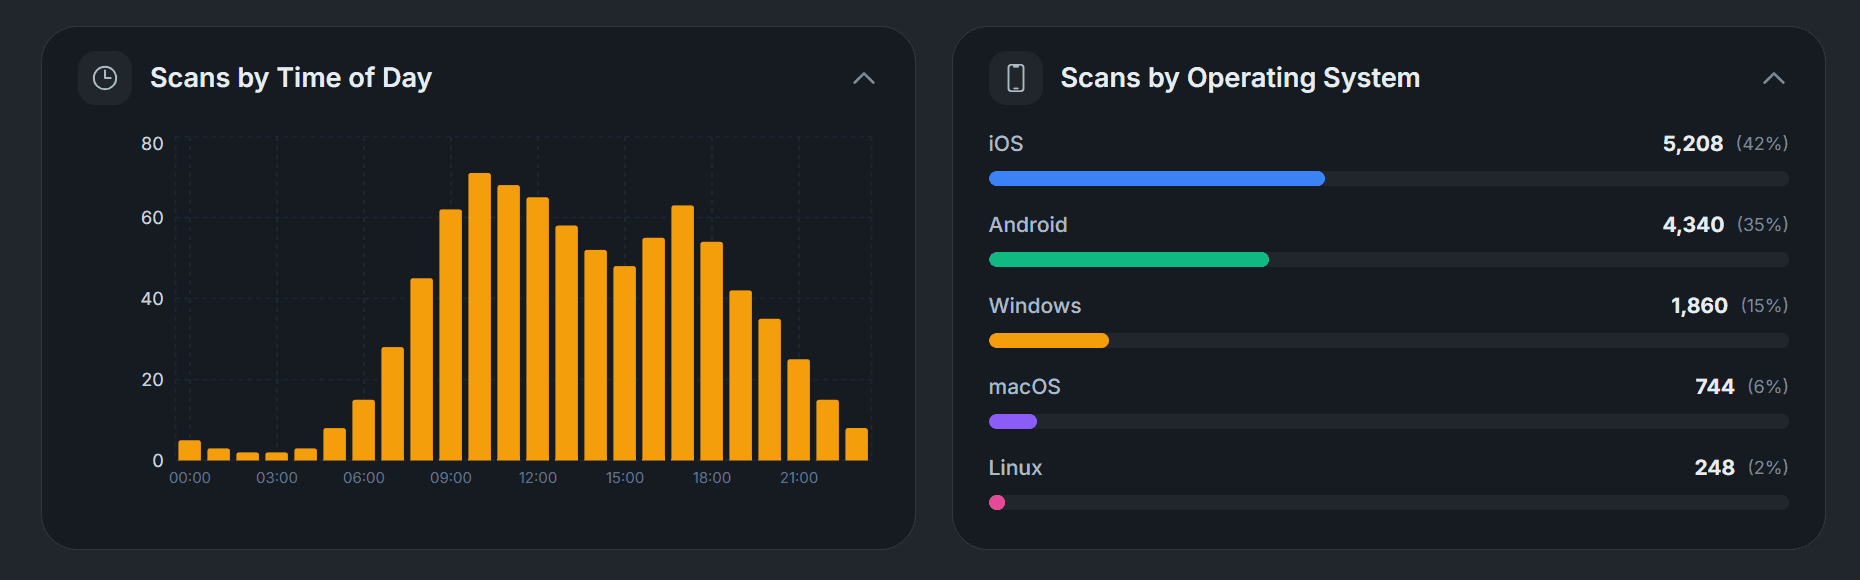
| Operating system | iOS vs Android, indicating the Apple or Google ecosystem split |
| Browser | Safari vs Chrome vs others |
| Scan time and date | Peak hours and days for your audience |
| Scan history | Full historical log with no time cap |
No data retention limit
All historical scan data is retained without a time limit. Compare scan data from six months ago against last week without needing to export or archive it manually. Many platforms delete scan history after 60 to 90 days; QRForever does not.
How to Use Scan Analytics in Practice
Print campaign ROI
Place a unique QR code on each print asset: business card, flyer, poster, package insert. Compare scan volumes to identify which placements drive the most engagement. A flyer generating three times the scans of a business card for the same campaign tells you where to concentrate print spend.
Geographic validation
If a campaign targets Mumbai but analytics show 60% of scans coming from Delhi, the placement or distribution strategy is off. Analytics reveal this in days, not at campaign end.
Time-of-day optimization
A restaurant with a QR menu can see whether scans peak at lunch or dinner, confirming customer traffic patterns and informing staffing and prep decisions.
How to Track QR Code Sales Performance
Scan counts alone do not tell you whether a QR code is making money. To connect scans to sales, tag your codes by campaign and location: one code for the window poster, one for the shelf display, one for the delivery insert. Because each code has its own scan log, you can see exactly which placement is pulling its weight instead of guessing from a single blended number.
Then cross-reference scan-time spikes with your sales data. If scans on the in-store display peak between 6pm and 8pm and your point-of-sale records show a matching revenue lift in the same window, you have a defensible attribution story for that placement. The same works in reverse: high scans with flat sales points to a landing page or offer problem, not a placement problem.
This kind of analysis only works if your scan history is still there when you need it. QRForever retains your full scan history with no retention cutoff, so you can line up last quarter's campaign scans against last quarter's sales, or compare this season against the same season a year ago, without exporting and archiving data before it disappears.
What We Track
Comprehensive data for every scan on your dynamic QR codes
Total Scans
Track the total number of times your QR code has been scanned. Monitor growth trends over time.
Unique Visitors
Distinguish between total scans and unique people who scanned your code. Understand true reach.
Geographic Location
See where your scans are coming from by city and country. Identify top-performing regions.
Time & Date Tracking
Know exactly when people scan your codes. Identify peak hours and days for engagement.
Device Information
See which devices people use to scan: mobile, tablet, or desktop. Optimize your landing pages.
Operating System
Track iOS vs Android vs other operating systems to understand your audience better.
Browser Data
See which browsers are being used to ensure compatibility with your QR code destinations.
Historical Data
Access complete scan history. Compare performance across different time periods.
How Businesses Use QR Analytics
Make data-driven decisions with actionable insights
Marketing ROI
Measure the effectiveness of print campaigns by tracking which materials generate the most scans.
A/B Testing
Compare performance of different QR placements, designs, or call-to-actions.
Event Engagement
Track booth visits, session attendance, and material pickups at conferences and events.
Retail Performance
Measure in-store engagement on product displays, shelf talkers, and point-of-sale materials.
Geographic Targeting
Identify which locations have the highest engagement to focus marketing efforts.
Time Optimization
Discover peak engagement times to schedule complementary digital campaigns.
Understanding QR Code Analytics and Scan Tracking
QR code analytics transform simple QR codes into powerful marketing and business intelligence tools. When you use a QR code tracking solution like QRForever, every scan becomes a data point that helps you understand your audience, measure campaign effectiveness, and make smarter business decisions. Without analytics, you're essentially flying blind. Printing QR codes without any insight into whether they're actually driving engagement.
What QR Code Scan Statistics Reveal
Modern QR code metrics go far beyond simple scan counts. Our comprehensive tracking captures:
- Temporal patterns. Understand when your QR codes get the most engagement. Discover peak scanning hours, high-performing days of the week, and seasonal trends.
- Geographic insights. See exactly where your scans originate. City-level data helps identify successful markets and underperforming regions.
- Device demographics. Know whether your audience primarily uses iOS or Android devices, which helps optimize landing page experiences.
- Engagement quality. Distinguish between unique visitors and repeat scanners to understand true reach versus engagement depth.
Measuring QR Code ROI for Marketing Campaigns
One of the biggest challenges in traditional marketing has been measuring the effectiveness of offline channels. QR code performance tracking finally provides a solution. By assigning unique QR codes to different marketing materials (print ads, billboards, trade show materials, product packaging), you can directly measure which offline placements drive the most engagement.
Calculate your QR code ROI by comparing scan data against your marketing investment. If a billboard campaign generates 500 scans that convert to 50 customers, you can directly attribute those conversions to that specific offline touchpoint. This level of attribution was previously impossible with traditional print media.
Real-Time vs. Historical Analytics
QRForever's QR code dashboard provides both real-time and historical data views. Real-time tracking lets you monitor active campaigns as they unfold: perfect for events, product launches, or time-sensitive promotions. Historical data enables trend analysis, helping you identify patterns across weeks, months, or years.
The ability to compare performance across time periods is crucial for optimization. Did your summer campaign outperform spring? Is weekday engagement growing while weekend scans decline? These insights drive strategic decisions that improve campaign performance over time.
Analytics for Different Industries
QR code insights serve different purposes across industries:
- Retail. Track which in-store displays generate the most product page visits and purchases.
- Restaurants. Monitor menu QR usage patterns to understand dining behaviors and peak hours.
- Events. Measure booth traffic at trade shows and conference engagement levels.
- Real Estate. See which property listings generate the most interest from yard signs.
- Healthcare. Track patient information access while maintaining privacy compliance.
- Manufacturing. Monitor product documentation and warranty registration scans.
Actionable Insights, Not Just Data
The goal of QR code analytics isn't just to collect data. It's to drive better decisions. Every metric in your QRForever dashboard is designed to be actionable. Low scans in a region? Consider different placement strategies. High scans but low conversions? Optimize your landing page. Our analytics help you continuously improve your QR code campaigns for maximum impact. Learn more about creating trackable codes withdynamic QR codes.
QR Code Analytics FAQ
Common questions about tracking QR code scans
What is QR code analytics?
QR code analytics is the data collected each time someone scans a dynamic QR code. When a user scans a dynamic code, the scan is routed through a redirect server before reaching the destination URL. That server-side step is what captures the analytics data, including location, device, and time of scan.
Can static QR codes be tracked?
No. Static QR codes have the destination URL baked directly into the pattern, so there is no server redirect and no event to log. Only dynamic QR codes, which route each scan through a redirect server, can be tracked.
What data does QRForever capture for each scan?
QRForever records total scans, unique visitors, country, city, device type, operating system, browser, and the time and date of each scan. Every scan is added to a full historical log with no time cap.
How long is scan analytics data kept?
QRForever retains historical scan data without a time limit. You can compare scan data from six months ago against last week without needing to export or archive it manually.
Does QR code tracking work in real time?
Yes. Each scan is logged as it happens and then the user is redirected to the destination, so your dashboard reflects new scans in real time. This is useful for events, product launches, and time-sensitive promotions.
How do I track QR code sales performance, not just scan counts?
Give each campaign, location, or product its own QR code, then cross-reference scan timing and location data with your sales records. If scans from a shelf display spike on weekends and your point-of-sale data shows a matching sales lift, you can attribute that revenue to the placement. QRForever keeps your full scan history with no retention cutoff, so you can compare campaign periods against sales periods months apart.
What's the difference between a QR analytics dashboard and Google Analytics?
A QR analytics dashboard tracks the scan event itself: when and where a physical code was scanned, on what device, before the visitor ever reaches your website. Google Analytics starts measuring only after the page loads, and it cannot tell you which printed material triggered the visit. The two are complementary: QR analytics attribute offline placements, while Google Analytics measures what visitors do on the site afterward.
Start Tracking Your QR Code Performance
Create a free account and get your first dynamic QR code with full analytics included.