QR Code Statistics 2026: What Over 70,000 Real Scans Reveal
Most QR code statistics online are recycled estimates. These are not. This report analyzes more than 70,000 real, anonymized QR code scans across the QRForever platform in 2026: which devices, which countries, which QR types, and what it means.

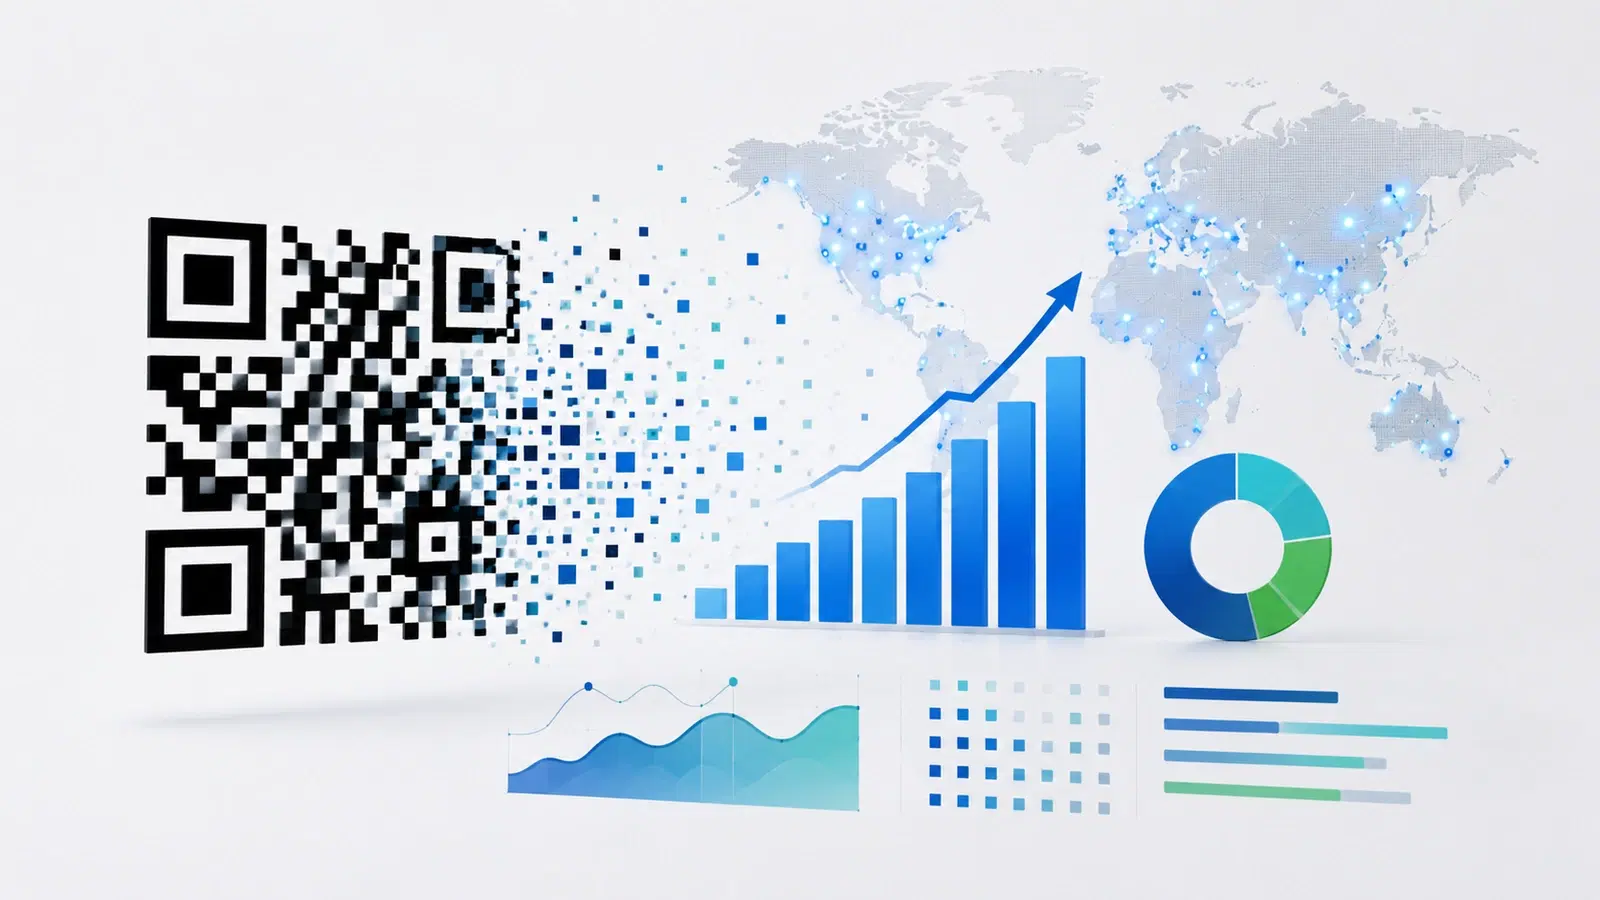
Search for QR code statistics and you will find the same recycled numbers repeated across dozens of articles, most of them estimates, projections, or figures with no clear source. They are hard to trust and harder to cite with confidence.
This report is different, because it is based on real data. Specifically, it analyzes more than 70,000 anonymized QR code scans that actually happened across the QRForever platform, current as of August 2026. Every figure here comes from genuine scan events, not an estimate or a forecast.
A clear and honest note on scope, up front: this is data from one platform, QRForever, not the entire QR code industry. It reflects how QR codes are actually being scanned across our user base, which spans 120 countries, but it is our platform's data, not a claim about all QR codes everywhere. We think transparent first-party data from a real platform is more useful than another recycled industry estimate, precisely because you know exactly what it is.
Here is what more than 70,000 real scans reveal about how QR codes are used in 2026.
Methodology: What This Data Is (and Is Not)
Before the numbers, it is worth being precise about what they represent, because that is what makes them trustworthy.
What the data is:
- More than 70,000 real, anonymized QR code scans across the QRForever platform
- Current as of August 2026
- Aggregated and anonymous: no personal information, no individual tracking, just counts and categories
- Drawn from scans across 120 countries
What the data measures:
- Scan counts and timing
- Approximate country (from IP, at country level only)
- Device type, operating system, and browser
- The type of QR code scanned (URL, PDF, vCard, and so on)
What the data is not:
- It is not a measure of the entire QR code industry. It is one platform's usage.
- It is not a projection or forecast. Every number is a count of scans that actually occurred.
- It does not identify anyone. All figures are anonymous and aggregate, consistent with the privacy approach described in our QR code privacy guide.
Why we round down: Throughout this report, figures are rounded down rather than up. When we say "more than 70,000 scans," the real number is somewhat higher. We would rather understate than overstate, so every figure here is a floor, not a ceiling.
With that clear, here is what the data shows.
QR Codes Are Overwhelmingly a Mobile Behavior
The single clearest finding in the data is how completely QR code scanning belongs to mobile phones.
More than 95% of all scans happen on mobile devices. Of every scan in the dataset, the overwhelming majority came from a mobile phone. Desktop and tablet scans exist, but together they account for a small fraction of the total. Mobile is not the leading way people scan QR codes; it is very nearly the only way.
Why this matters enormously: This is the most actionable statistic for anyone using QR codes. Since nearly every scan is on a phone, the page a QR code opens must be excellent on mobile. Not acceptable, excellent. A landing page that works on desktop but is slow or clumsy on mobile is failing almost every single person who scans. We cover this in depth in our QR code landing pages guide, and the data here is the reason it matters so much.
Browser breakdown: Among scans, Chrome is dominant, accounting for the large majority of scans, followed by Safari as a distant second. Other browsers (Edge, Firefox, and the rest) make up only a small slice combined. In practical terms, if your QR landing page works well in Chrome and Safari on mobile, you have covered the vast majority of real scanners.
The takeaway: Design and test every QR code destination as a mobile experience first, because that is what more than 95% of your scanners will actually use. Reviewing your QR landing page only on a desktop, as many people do, means never seeing it the way almost all your scanners do.
Pro Tip
With more than 95% of scans on mobile, the most important test you can run is to scan your own QR code with a phone, on cellular data, and see exactly what your scanners see. If it is not fast and easy there, it is not fast and easy for almost anyone who scans.
What People Actually Point QR Codes At
The data on QR code types reveals what people are really using QR codes to do, and the answer is simpler than the endless list of possible QR types might suggest.
URL codes dominate overwhelmingly. The large majority of all scans, well over 90% of them, are of URL-type QR codes: codes that link to a web page. Despite the many specialized QR types available (vCard, WiFi, event, and so on), the core use by a wide margin is simply "take me to a web page."
The types that follow, in order: After URL codes, the next most-scanned types in the data are:
- PDF codes: linking to a document, the clear second place, though far behind URL
- Video codes: linking to video content
- Multi-link codes: a landing page with several links
- vCard codes: digital contact cards
- WhatsApp codes: opening a chat
What this tells us: The QR code, in practice, is overwhelmingly a bridge to the web. The specialized types have their place and real value for specific use cases, but the dominant behavior is linking to a page. This reinforces why the destination page matters so much: for most QR codes, the page is the entire experience.
The practical implication: If you are deciding what to do with a QR code, know that you are in good company using it simply to link to a well-designed web page. That is what most scans are, and it is where most of the value is. The exotic QR types are worth using when they fit, but the workhorse is the humble URL code pointing at a good mobile page. See our guide to what QR codes can do.
- URL codes: the large majority of all scans, over 90%
- PDF codes: a distant but clear second
- Video codes: linking to video content
- Multi-link codes: a page with several links
- vCard and WhatsApp codes: smaller but active shares
Geographic Reach: 120 Countries and Counting
The scans in this dataset came from 120 countries, which says something about how universal QR code scanning has become.
A genuinely global behavior. Scans arrived from 120 different countries, spanning every inhabited continent. QR code scanning is not a regional phenomenon; it is a worldwide behavior that works the same way on any modern phone, anywhere, thanks to the native camera scanning covered in our how QR codes work guide.
The distribution is concentrated, then long-tailed. While 120 countries appear in the data, the distribution is heavily concentrated. India accounts for the largest share by a wide margin, more than 80% of all scans in the dataset, reflecting where much of QRForever's user base and their audiences are located. After India, the United States is the second-largest source of scans, followed by Brazil, Spain, the United Arab Emirates, Thailand, France, Italy, the United Kingdom, and Switzerland rounding out the top ten.
An honest note on this concentration: This India-heavy distribution reflects QRForever's specific user base, not global QR adoption. A different platform with a different user base would show a different distribution. We include the real figures rather than a tidied-up version because transparency is the point of a first-party data report. For a deeper look at the India data specifically, see our companion report, the State of QR Code Usage in India.
What the long tail shows: The presence of 120 countries, including many with only a handful of scans, demonstrates the reach of QR codes as a technology. A code created by a user in one country gets scanned by people in dozens of others. That borderless quality is part of what makes QR codes such durable infrastructure.
Scanning Is Constant, Not Occasional
The timing data shows that QR code scanning, at least across an active platform, is a steady, continuous behavior rather than an occasional novelty.
Scans happen throughout the day, every day. Across the platform, a QR code is scanned on average every 15 minutes or so, continuously, day after day. This is not bursty, event-driven activity; it is a steady baseline of scanning that reflects QR codes being woven into everyday transactions, menus, payments, and information access.
What steady scanning tells us: When a behavior becomes constant rather than occasional, it has crossed from novelty into infrastructure. People are not scanning QR codes as a special event; they are scanning them as an ordinary part of daily life, the way they tap a card or open an app. That shift, from novelty to routine, is the real story of QR codes in the 2020s, and this steady scan cadence is what it looks like in the data.
Recent activity: In the most recent full month of the dataset, the platform recorded well over 2,000 scans, continuing the steady pattern. The behavior is not slowing; the baseline of everyday scanning holds and grows.
The bigger picture: Put together, the data tells a consistent story. QR code scanning in 2026 is overwhelmingly mobile, overwhelmingly about linking to web pages, genuinely global across 120 countries, and constant rather than occasional. These are not the characteristics of a fad. They are the characteristics of infrastructure, quietly embedded in how people connect the physical and digital worlds. For where this is heading, see our QR code trends 2026 report.
Important
When you see QR code statistics elsewhere claiming precise global adoption figures or scan totals in the billions, ask where the number comes from. Many widely-repeated QR statistics trace back to estimates with no clear methodology. First-party platform data like this report is narrower in scope but genuinely verifiable, which is a fair trade.
Conclusion
More than 70,000 real scans across the QRForever platform, spanning 120 countries, paint a clear and consistent picture of how QR codes are actually used in 2026. Scanning is overwhelmingly mobile, with more than 95% of scans on phones. It is overwhelmingly about the web, with URL codes making up the large majority of scans. It is genuinely global, reaching 120 countries. And it is constant, a steady everyday behavior rather than an occasional novelty.
The single most actionable takeaway is the mobile one: since nearly every scan happens on a phone, the page your QR code opens must be excellent on mobile, or it fails almost everyone who scans. The rest of the data reinforces that QR codes have become quiet infrastructure, the ordinary way people bridge the physical and digital worlds.
We have shared this as transparent first-party data rather than another recycled estimate, clearly labeled as one platform's usage, because verifiable real numbers are more useful than unsourced industry figures, even when they are narrower in scope. If you cite these figures, please note they are QRForever platform data as of August 2026, and remember they are rounded down, so the real numbers are somewhat higher.
Related reading:
Create a trackable QR code with QRForever. Start a 7-day full-access trial, no credit card needed. See your own real scan data: device, location, and more.
Explore QRForever Solutions
Ready to Create Your Own QR Codes?
Start creating dynamic QR codes for your business today. Track analytics, update content anytime, and never reprint again.
Related Articles

The Future of QR Codes: Predictions for 2026 and Beyond
What is coming next for QR codes: AR integration, AI personalization, and payment evolution. An honest look at which predictions materialized, which did not, and what to expect. Updated July 2026.
QR Code Trends 2026: 10 New Use Cases Emerging This Year
QR codes have moved well past restaurant menus. From packaging transparency to memorial pages, event access, and offline creator growth, here are ten use cases genuinely gaining ground in 2026 and what they signal about where QR is heading.
Why QR Codes Survived (and Thrived) After COVID: A 2026 Retrospective
QR codes had failed before. The pandemic gave them a second chance, and this time they stuck. Here is an honest look at why the technology that flopped in 2012 became permanent infrastructure by 2026, and what actually changed.